In a normal year, steady trade winds blow from east to west along the equator, pushing the Pacific's warm surface water toward the western side, near Southeast Asia.
But when the wind is below normal, the warm waters will flow to the west coast of South America.
Every few years, this strip of warm water in the equatorial Pacific reshapes rainfall across an entire ocean.
For mainland nations, it's a footnote in weather reports.
But for Pacific island countries, it can mean the difference between harvest and hunger.
Pacific Agriculture in the Shadow of El Niño
Here's the story of El Niño and why its next return matters more than ever
for Pacific islands where the harvest is also the economy.
A project by Bayu Prahara August 2026
SST Anomaly (°C)
-3-2-10123
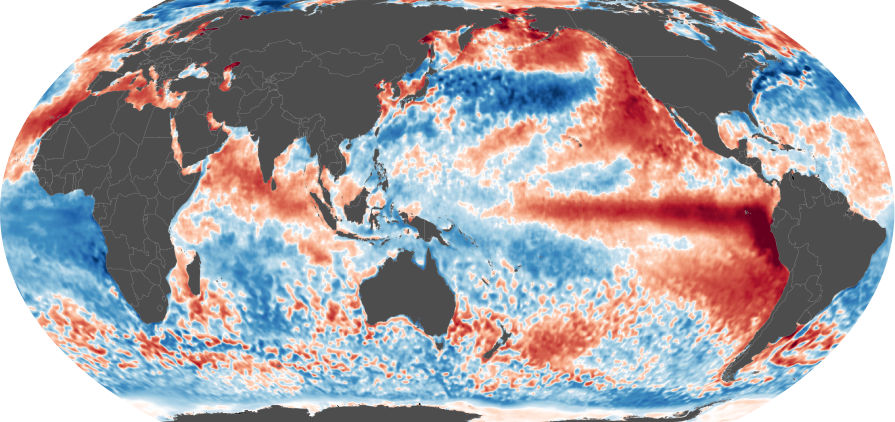
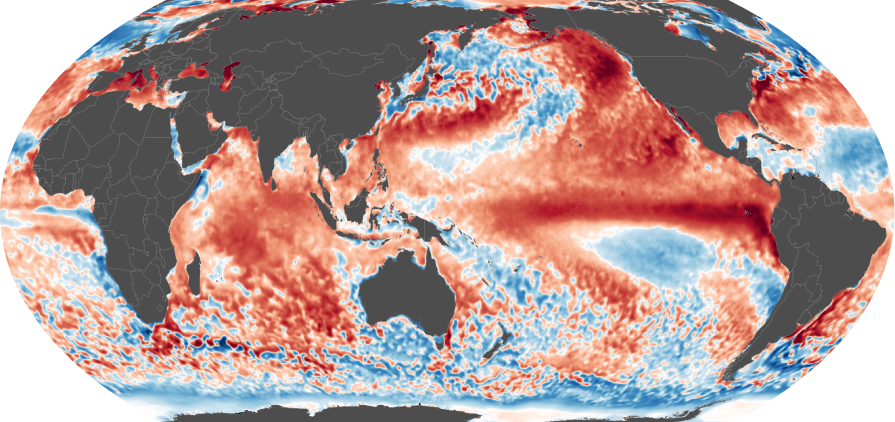
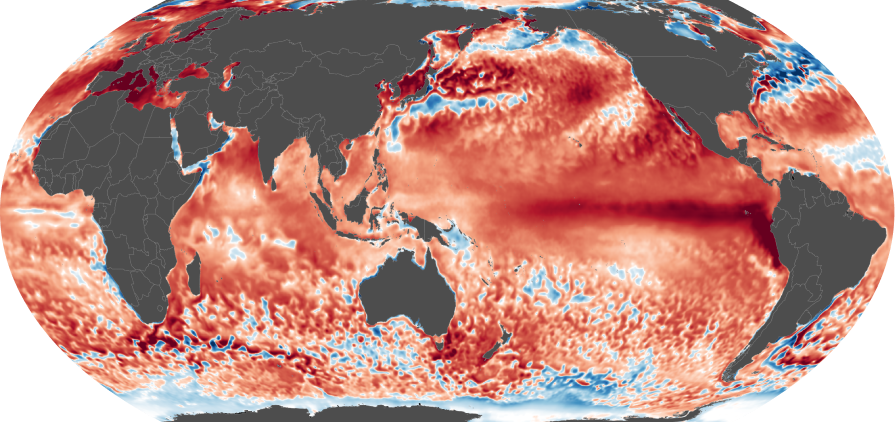
Each globe averages daily anomalies across June, the same stage in each El Niño's
development, not the month it began. By the RONI index all three events were close to
equal in strength. Anomalies run against a fixed twentieth-century baseline, so the red
spreading between 1997 and 2026 is mostly the ocean's warming background, not a fiercer
El Niño. Source: NOAA OI SST V2 High Resolution Dataset, provided by NOAA PSL, Boulder,
Colorado.1
El Niño is a weather pattern in the Pacific Ocean where winds push warmer-than-normal
surface water to the Indian Ocean. When the wind becomes weaker, the ocean's warm water
drifts back toward the west coast of South America. Thick clouds gather, heavy rain pours
down, and cold-water fish slowly vanish from the waters off Ecuador and Peru.
The phenomenon tends to peak around Christmas, which is why local fishermen named it El Niño,
which means "the Christ Child". Meanwhile, La Niña happens when ocean temperatures drop below
normal and strong winds push warm water from east to west. El Niño and La Niña are two phases
of the same recurring cycle and both have effects that can be felt globally.2
Relative Oceanic Niño Index (RONI), 1990–2026
RONI measures sea-surface temperature anomalies in the central and eastern Pacific Ocean.
Positive values indicate El Niño conditions, while negative values reflect La Niña phases.
Values are seasonal, averaged over three-month periods. The dashed lines mark the ±0.5 °C
threshold NOAA uses to separate the two phases.
The 1997–98 El Niño remains the most damaging event on the satellite record for Pacific
island nations.4 Water shortages, coral bleaching, disease
outbreaks, and crop failures were among its effects. The problem that makes El Niño complicated is that no two nations feel the same effect.
In the southern Pacific, nations such as Vanuatu, Fiji, and New Caledonia tend to experience
a dry season from May to October during El Niño. While in the central and northern Pacific
area, it can be the opposite. The rainfall intensity becomes heavier during the same period
(and potentially experience a delayed drought). Geographic location, island elevation, and
local climate patterns decide whether an island faces drought or flooding.5
Annual Rainfall Anomaly Relative to Each Island's Long-Term Local Baseline
Blue indicates wetter-than-normal conditions, while red indicates drier-than-normal
conditions. Annual anomalies may still appear mixed during El Niño because rainfall
responses vary across islands and seasons. Select a pin to read its value.
Rainfall Anomaly
Wetter than normalNear normalDrier than normal
199019902025
Source: Pacific Data Hub .Stat Explorer, Climate Change Indicators.6
As mentioned earlier, not every nation experiences drought. Kiribati and the Marshall Islands,
for instance, actually receive heavier rainfall during El Niño. Reduced rainfall in some
Pacific countries directly affects the main income of people who depend on the agricultural sector.
Drought recorded in Fiji caused sugarcane production to fall sharply and dragged GDP down by
at least 1.3%. Not only that, the loss in the livestock sector amounted to around USD 7 million.
Significant declines in agriculture were also recorded in other regions, such as Papua New Guinea.
Around 1 million people, or 20% of the population, experienced food insecurity due to the failure
of food crops.7
Historical drought impacts in when
Average rainfall decline during the 1997–98 and 2015–16 El Niño events. Values are shown
for drought-affected locations within each country. Use the selectors above to switch
country and event.
El Niño does not guarantee more tropical cyclones across the entire South Pacific in every season.
Instead, it changes where favourable conditions for cyclone development occur.89 During El Niño, cyclone formation and tracks tend to shift eastward toward the central Pacific,
changing which island countries are most exposed.1011
The chart below separates tropical depressions, tropical cyclones and severe tropical cyclones.
It shows that seasonal totals and storm intensity can vary widely: a season with fewer recorded
systems can still contain several severe cyclones.
Recorded Tropical Systems by South Pacific Season, 1990–91 to 2025–26
El Niño influences the location and characteristics of cyclone activity, not a uniform
increase in the basin-wide seasonal total. Select a season to inspect its composition and
the strongest recorded storm.
Tropical depressions Tropical cyclones Severe tropical cyclones
Source: NOAA IBTrACS, version 4r01, South Pacific basin.12
This evidence shows how El Niño can increase losses in society and the economy.
El Niño is not easy to understand because it affects many areas.
But economists have found ways to measure how much it adds to current problems,
and the numbers are not small.8
Potential Average Annual Cyclone Losses
Annual average losses from tropical cyclones across Pacific island nations, in USD million.
Switch on the El Niño factor to re-rank the list against 2015 projected potential losses.
Climate change doesn't create El Niño. And El Niño is not new.1314 But the world in 2026 is not the same as the world in 1998.
El Niño events in the coming years may be far worse than those of 10 or 27 years ago.
Sea levels are higher, the oceans are warmer and the margin for error is narrower.1516
Historical Sea Level and Sea Surface Temperature
Sea level is measured relative to the 1999 baseline; the SST anomaly is the
deviation from the long-term climatological mean. Since 1999–1999, sea level has been rising +0 cm.
Meanwhile the mean sea surface anomaly in 1999 is -0.16°C
Yet even our understanding of the damage El Niño causes is incomplete.
In Pacific Island Countries and Territories, research on meteorological drought has improved.
There is now better understanding of when and where rainfall decreases. But many impacts are still unclear,
such as how long soils stay dry, when crops die, when groundwater becomes salty, and how drought and
cyclones happen one after another. The region still does not have enough good data to fully understand drought
across its islands and atolls. Our knowledge is made of fragments, while the unknown may be much larger.5
But who bears the cost is not in question. Pacific Island countries register the greatest negative impacts
of climate change while contributing just 0.03% of the world's total greenhouse gas emissions.17
Annual CO2 Emissions (2024)
Carbon dioxide emissions from fossil fuels and industry, in tonnes. Land-use change
emissions are not included.
#1
Papua New Guinea
8,350,000tonnes CO2
#2
New Caledonia
5,290,000tonnes CO2
#3
Fiji
1,450,000tonnes CO2
#4
French Polynesia
922,867tonnes CO2
#5
Solomon Islands
294,648tonnes CO2
Source: Global Carbon Budget (2025), with major processing by Our World in Data.18
Their agriculture is rain-fed, grown on low-lying land, and deeply tied to cultural identity.
It's how they survive and who they are. El Niño will come again. And again. Each time it does,
the same question arises: will they be able to recover?
In Vanuatu and Solomon Islands, agriculture makes up more than 70% of total exports.
One bad harvest season is not just a matter of food on the table, but a destabilization of national revenue.
About three-quarters of workers in Papua New Guinea are in agriculture and forestry.
In the Marshall Islands, 64% of the land is arable, but agriculture contributes just 1% of GDP.
It feeds families. But when the harvest fails, there's no other income to fall back on.19
So when El Niño dries the ground, and the yams don't grow, it is not only hunger that follows.
In Tuvalu, communities have long associated drought with divine punishment.
It's a sign that leadership has failed, that something in the social order must be corrected.
Chiefs step down and new leaders are called upon to bring rain.5 Yet some church leaders today push back on that verdict,
insisting the fault lies not with God, but with those who broke what he made.20 When the next El Niño comes,
and the crops fail again, and the skies remain empty, who will they blame then?
If drought is divine punishment, why does the punishment hit hardest on countries
responsible for just 0.03% of the emissions that warmed the sky above them?